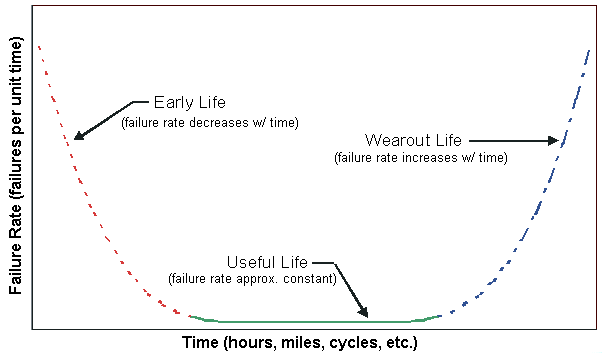
One of the most commonly used tools to quantify failures is the Weibull or “bathtub” curve. To understand the basic concept, you don’t have to understand all the math behind it.
First, let’s look at a simple graph of the Weibull distribution.
This example has failure rates equal at the left (new unit) and right (old unit) extremes. Either may be reduced by design and manufacturing improvements.
Note that the failure rate is not quantified, but the concept is the same. The failure rate is lowest during the Useful Life period. Ideally this should be the warranty interval. Lowering the failure rate should be a priority, but dealing with the current failure rate is a reality. To maximize profit and customer satisfaction:
- Record failures and calculate the rate of failure to understand where to begin. It can be simply expressed as
Failure Rate = no. of failures/ total time in service - Don’t ship products that are Early Life failures.
Obvious, right? This can be done with a robust design process, screening out early failures, and warranty coverage of the early failures that escape the screening. Warranty costs should be monitored and reviewed as critical quality data (Key Measure). - Prepare a strategy for the Wearout Life.
For some products, this will be irrelevant (e.g. cellphones–most models will become obsolete before they reach the Wearout Life period). For the rest, it becomes quite complex, as you might consider overhaul or replacement, depending on the cost and complexity vs. a new unit.

